Delta2D Report: Blotting for Project 'Coverage Report'
Project Properties
Author
DECODON Team
Project Creation Date
Tue Nov 01 09:20:00 CET 2016
Use Internal Standard
no
Pool
C:\data\Blot report
Description
Comparison Totalprotein and 2D western blot
Report created by user "bielz" with Delta2D, Fri Nov 04 10:16:26 CET 2016.
Please let us know if you have any comment or suggestion using our contact form.
Specify this Report
Sample to Gel Assignment
Group Name
Gel
Channel
Removed Speckles
Gel Image Name
Total Protein
Not assigned
Silver
black: 8; white: 0
Bet v 1 Silverstain
2D WB
Not assigned
Not assigned
black: 8; white: 6
WesternBlot-Bet v 1
Experimental Setup
Used approach: This is a 'Gel - Membrane / Western Blot' project.
The coverage between each Gel image and Western Blot image is computed with this formula:
Coverage (COV2) =
No. spots Western Blot Image
* 100%
No. spots Total Protein Image + No. unmatched spots Western Blot Image
The coverage among the same kind of image (Gel, Western Blot) is computed with this formula:
These image pairs have been warped to eliminate gel distortions.
Warped Image
Warped to Image
Warp Mode
Match Vectors
Fused Image using Max Intensity at 01_11_2016 11_35_38_845
Bet v 1 Silverstain
global
1
WesternBlot-Bet v 1
Bet v 1 Silverstain
exact
10
Fused Images from Group 'Fused Images'
Fused Image Name: Fused Image using Max Intensity at 01_11_2016 11_35_38_845
Master Gel Image: Bet v 1 Silverstain
Input images: Bet v 1 Silverstain, WesternBlot-Bet v 1
Input images have been processed before fusion by applying: Remove Background, Amplitude Rescale
Fusion type: Max Intensity
Image sizes have been adjusted to: Common Region
Fused image has been processed by applying: Amplitude Rescale, Remove Background
Transferred Spot Pattern
Transfer Origin (Fused Image):
Fused Image using Max Intensity at 01_11_2016 11_35_38_845
Spot Detection Parameters
Local Background:
125
Average Spotsize:
41
Sensitivity:
20.0
# of originally detected spots:
916
# of manually added spots:
1
# of spots after spot editing:
917
# of canceled spots:
755
# of transferred spots:
162
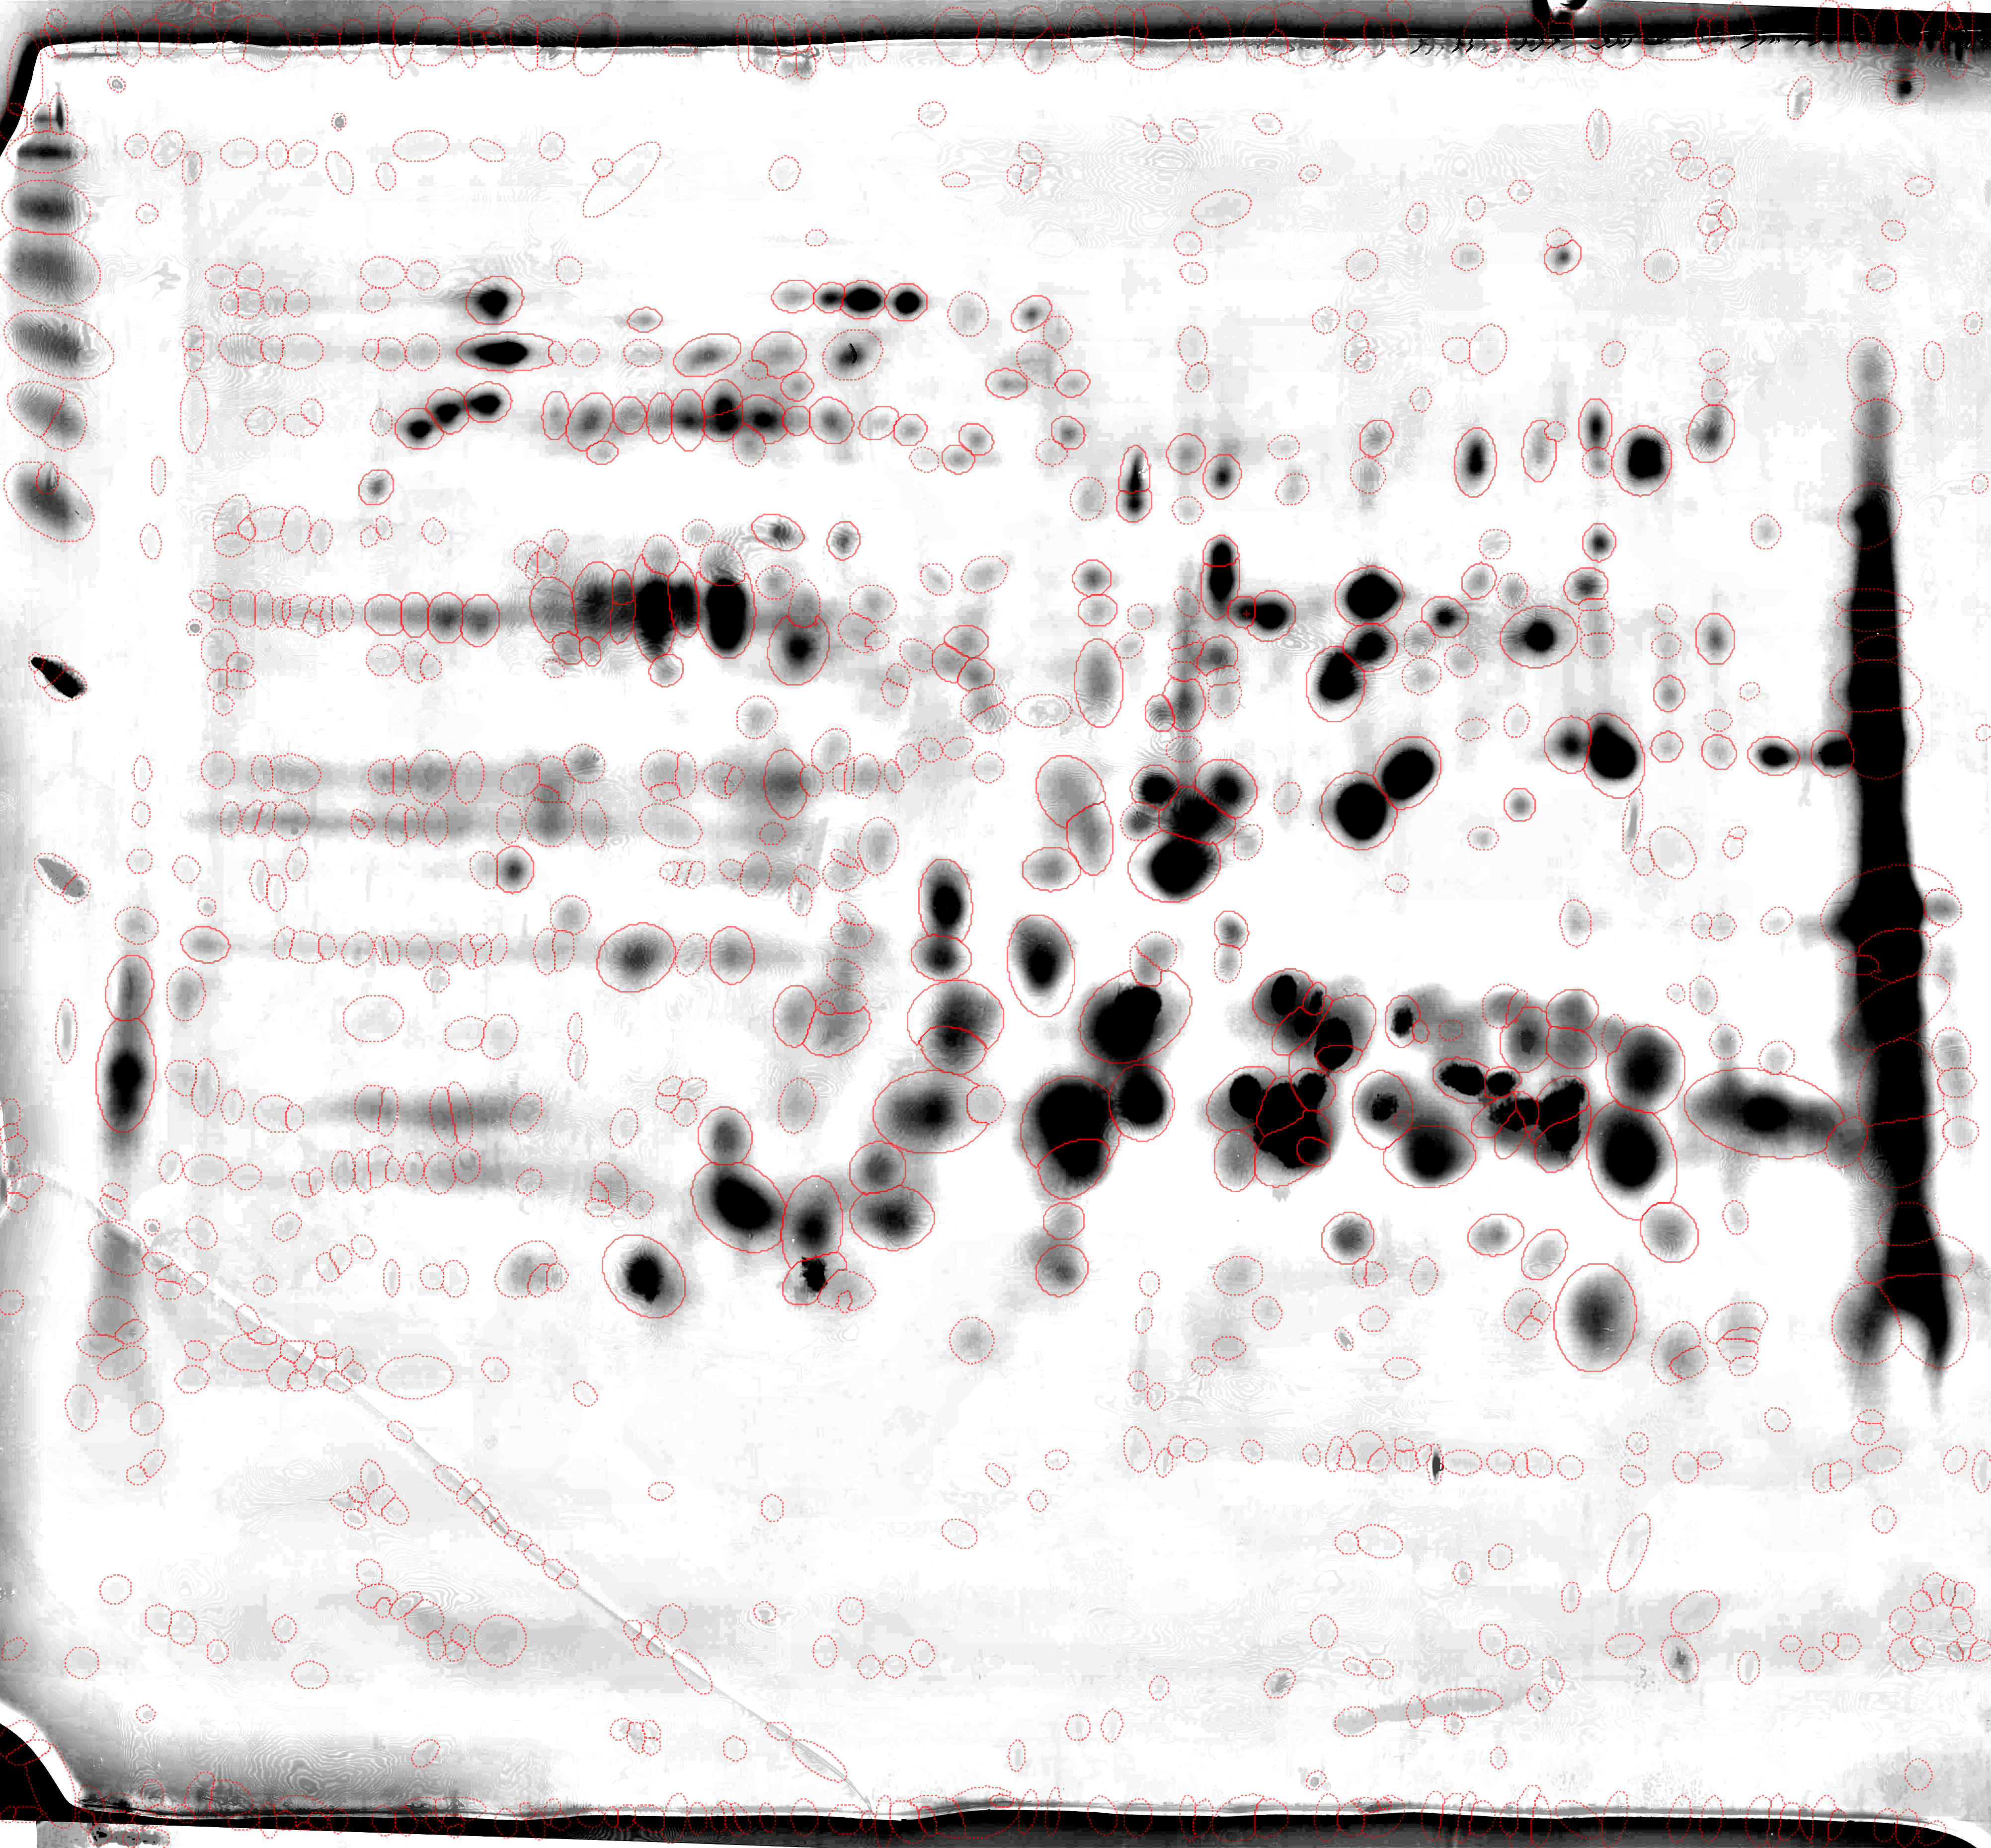
Fused Image 'Fused Image using Max Intensity at 01_11_2016 11_35_38_845'
Detected spots.
Canceled spots.
Spot edit markers.
Image Pairs
Image pairs have been created in accordance with the 'Gel - Membrane / Western Blot' structure of this project.
Unmatched spots among filter settings in Delta2D.
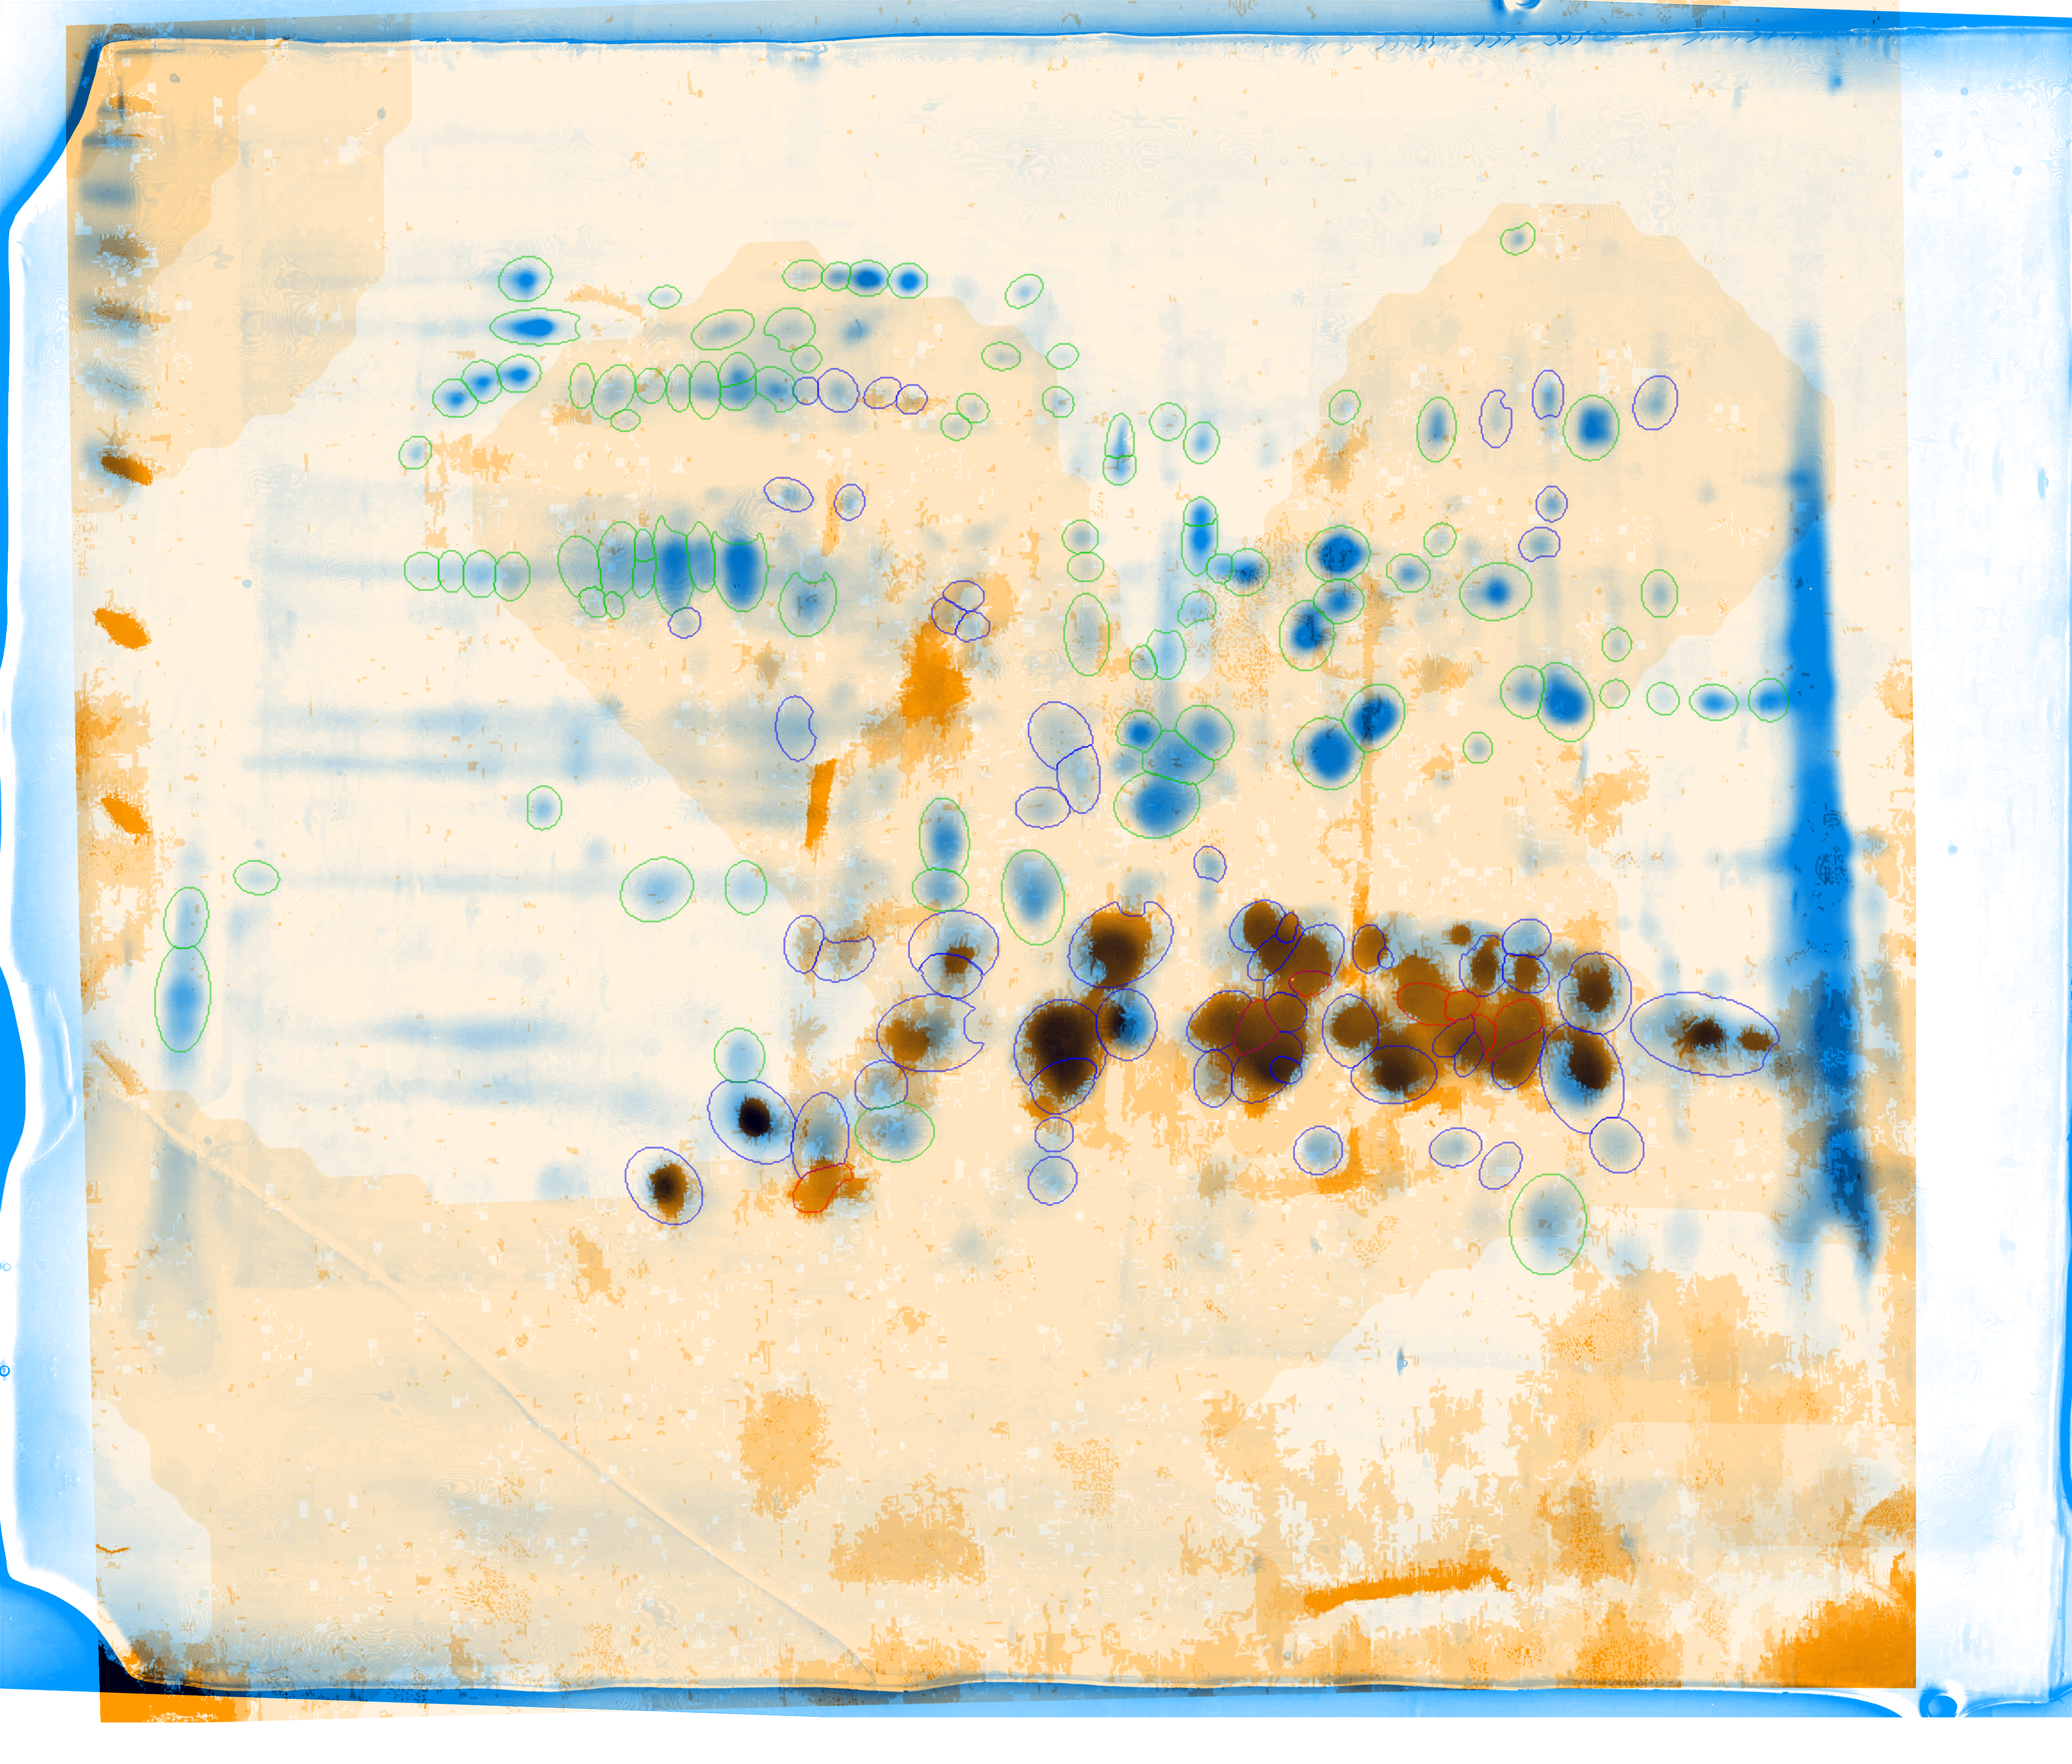
Dual View for
'Bet v 1 Silverstain' and
'WesternBlot-Bet v 1'
matched spots:
61 of 162 (blue)
Coverage: 41.98%
unmatched spots on Bet v 1 Silverstain:
94 of 162 (green)
unmatched spots on WesternBlot-Bet v 1:
7 of 162 (red)
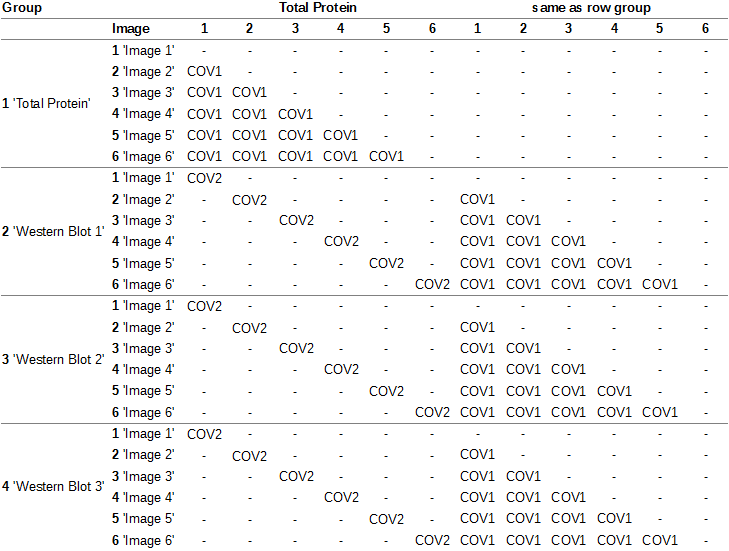
Coverage Table
Group columns are ordered in the same way as the group rows, i.e. the name of the image in column 2 of a certain group can be taken from the second row of the said group.
Group
Total Protein
same as row group
Image
1
1
Total Protein
1 'Bet v 1 Silverstain'
-
-
2D WB
1 'WesternBlot-Bet v 1'
68/162 41.98%
-
Results
Reproducibility for Image Pairs in Groups
Group
N
Mean
RSD
Total Protein
0
VV
N.A.
%
VV
N.A.
%
2D WB
0
VV
N.A.
%
VV
N.A.
%
Statistics on Relative Coverage for Group Pairs
Total Protein Group
Western Blot Group
N
Mean
RSD
Total Protein
2D WB
1
41.98
%
0.00
%
Remarks
Please note, that this Blotting report is just an example and as such was created from different Gel images than the rest of the project.
About the Report
Blotting Report Attachment (page 1 of 2)
Analysis Procedure
The project may contain up to 9 groups (plus fused image group and internal standard group), further groups will be ignored.
Each group may contain up to 6 images, further images will be ignored.
Image names are not longer than 35 characters, gel numbers not longer than 2 characters.
The group containing fused images is named 'Fused Images'.
A group called 'Internal Standard' will be ignored as this group is assumed to contain just internal standard images.
Spot transfer to all images must be done from the same fused image.
Experiment Structure
Westernblots with multi fluorescence, maximal 3 Westernblot dyes. Total-Protein group must be the first group in the project.
Image pairs:
each Total Protein Image with one Westernblot Dye N (N: 1...3) images in all groups must be sorted the same way to enable an appropriate assignment of each western blot image to the respective total protein image
all possible pairs within each group
Special coverage formula for image pairs Total Protein Image - Westernblot Dye
Example:
COV2 = Coverage formula for Total Protein - Western Blot approach:
Coverage (COV2) =
No. spots Western Blot Image
* 100%
No. spots Total Protein Image + No. unmatched spots Western Blot Image
A number of 1 (k) group 'Total Protein' and 3 (l) groups with 'Westernblot Dyes' with 6 (m) images each results in 6*3+4*(6*6-6)/2=78 image pairs, i.e. the same number of report pages, general: m*l+(k+l)*(m*m-m)/2.
Blotting Report Attachment (page 2 of 2)
Report Content
Section 'Sample to Gel Assignment':
The section shows a table summarizing the sample to gel assignment used in this Blotting Report.
Section 'Experimental Setup':
The coverage formulas are automatically applied.
Section 'Fused Images from Group 'Fused Images'':
On one page a maximum of 6 fused images is described (configurable).
Section 'Transferred Spot Pattern':
The number of spots after spot editing is the sum of originally detected spots and manually added spots.
The number of transferred spots is the difference between spots after spot editing and canceled spots.
Section 'Fused Image 'Fused Image using Max Intensity at 01_11_2016 11_35_38_845'':
The image shows all spots and spot edit markers (if available).
Canceled spots are shown with dotted spot boundaries.
Section 'Image Pairs':
Includes data for the interesting image pairs for which the 'Coverage' table includes values.
Images show spot boundaries for interesting spots only, not for canceled spots.
Matched Spots are shown in blue, unmatched in green or red, respectively.
Section 'Coverage Table':
Coverage is calculated based on the formula as shown in the examples above.
Coverage table is split after a maximum of 2 leading columns and 14 value columns and/or 2 leading rows and 40 value rows (configurable).
Groups will not be split.
To reduce the width of coverage tables a legend can be introduced.
Section 'Results':
'Reproducibility for Image Pairs in Groups' (1) and 'Statistics on Relative Coverage for Group Pairs' (2) are always based on the respective existing coverage values.
'Mean' is the mean of coverage value of each image pair
'RSD' (relative standard deviation) is the 'corrected sample standard deviation' (as defined in https://en.wikipedia.org/wiki/Standard_deviation), expressed in %.
'N' is the number of image pairs (1) or the number of replicates (2)
 Detected spots.
 Canceled spots.
 Spot edit markers.