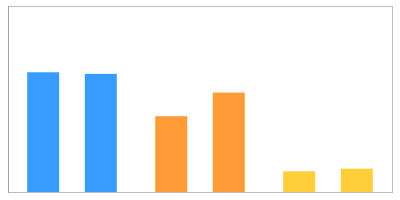
Profile

Quantities
The table shows normalized volumes (%Vol) of the visible expression profile for spot ID '13220' on gel image 'control_01'.
Ratios and p-values (using t-Tests) are computed relative to group 'control'.
| control | 1 min | 10 min | ||||
|---|---|---|---|---|---|---|
| control_01 | control_02 | 1min_01 | 1min_02 | 10min_01 | 10min_02 | |

|

|

|

|

|

|
|
| ID | 13220 | 13220 | 13220 | 13220 | 13220 | 13220 |
| Label | EF-Ts | (no label) | (no label) | (no label) | (no label) | (no label) |
| X | 589 | 523 | 515 | 486 | 513 | 517 |
| Y | 470 | 453 | 468 | 433 | 466 | 467 |
| %V | 1.2874 | 1.2707 | 0.8154 | 1.0690 | 0.2226 | 0.2504 |
| Ratio | - | 0.737 | 0.185 | |||
| p-value | - | 0.118 | 0.000 | |||
| RSD | 0.654 | 13.460 | 5.892 | |||
| mean | 1.279 | 0.942 | 0.237 | |||
| median | 1.279 | 0.942 | 0.237 | |||
| maximum | 1.287 | 1.069 | 0.250 | |||
| minimum | 1.271 | 0.815 | 0.223 | |||
Labels
| Scout | Attribute | control | Fused Images |
|---|---|---|---|
| control_01 | Fused Image | ||
| Label name(s) | EF-Ts | EF-Ts | |
| Pi/MW Estimation | Pi | N.A. | N.A. |
| MW | N.A. | N.A. | |
| GenoList | Gene Size (bp) |
0
|
0
|
| Protein Size (aa) |
0
|
0
|
|
| Function |
|
|
|
| Uniprot | Accession |
P80700
|
|
| Amino Acids |
293
|
|
|
| Function |
Associates with the EF-Tu.GDP complex and induces the exchange of GDP to GTP. It remains bound to the aminoacyl-tRNA.EF-Tu.GTP complex up to the GTP hydrolysis stage on the ribosome (By similarity).
|
|
|
| Gene name |
tsf
|
|
|
| Gene Ontology |
|
|
|
| Isoelectric Point |
4.9005
|
|
|
| Keywords |
|
||
| Molecular Weight |
32353.77
|
|
|
| NCBI Taxonomy |
224308
|
|
|
| Organism |
Bacillus subtilis (strain 168)
|
|
|
| Original label name |
EF-Ts
|
|
|
| Protein name |
Elongation factor Ts
|
|
|
| Query text |
EF-Ts
|
|
|
| References |
|
||
| Sequence |
MAITAQQVKELREKTGAGMMDCKKALTETDGDMDKAIDLLREKGIAKAAKKADRIAAEGS
TLIKTDGNKGVILEVNSETDFVAKNEGFKELLNTLADHLLANTPADVEEAMGQKMENGST
VEEYITSAVAKIGEKITLRRFTVLTKDDSSAFGAYLHMGGRIGVLTVLNGTTDEETAKDI
AMHVAAVNPRYISRDQVSEEETNHERQILTQQALQEGKPENIVAKMVEGRLNKFFEEICL
LDQAFVKNPDEKVKQVIAAKNATVQTFVRYEVGEGIEKRQENFAEEVMNQVKK
|
|
|
| Title |
EFTS_BACSU
|
|
|
| Uniprot entry |
|
Position on Gel Image 'control_01'
