Start Using Paver with Example Data
Getting Started with Paver works easiest with some example data we prepared for you. You can do your first steps by simply loading the example data and playing around a bit, to see, how Paver works. Later, when working with your own data, you can use our data as example on how data should be formatted to be compatible with Paver. Technically, all files are simple text files containing the information which allows Paver to make those beautyful visualizations. You can open every one of them with any editor software, which is capable to interpret Linux and Apple text files as well. Simply have a look at their structure and formatting, and adapt your own files accordingly if Paver has problems with your own files.
Below you can download example data to see Paver's fascinating performance.
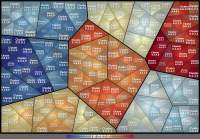
The files are zip - archives; simply extract them into a directory of your choice. You will obtain a subfolder for each, containing the hierachy structure in two or more formats (e.g. path format and simple format), as well as mass data matching these hierarchies in csv (Character Separated Values) format. The folders and files are named according to Paver's menu entries, so you can easily find the matching file(s) you have to load for creating your visualization. Let's create a treemap as example:
- Start Paver if it's not already running
- In Paver's menu click on File -> New -> Treemap -> Simple Format and navigate to the extracted "Example_Treemap" folder
- Pick the file "Treemap_Simple_Format.tms" or any variant from the "SimpleTreemapFormat" folder to load the hierarchy file.
- Now choose from Paver's menu Data -> Load Expression Data -> CSV Expression Data to load the data files as expression data.
- In the file chooser you can pick one or both "Treemap_Data_X.csv" files (where X stands for a number)
For now you will notice two things:
- The representation is all blurred, except for a small region around your mouse pointer
- A big yellow stripe on the top of the window with a button on its left saying "Activate"
The blurred view is the demo view you will always get when loading own data without having either activated it or using the full license for Paver. To activate data, you can use the just appeared "Activate" button. Click on it, and you can enter credentials of an evaluation account to activate the example data for free:
| User Name: | eval |
| Password: | paver |
Make sure the treemap and the expression data are selected (they are by default) and click on "Activate". After some seconds you will see the Activation Report in a small window and your blurred view becomes clear.
Once activated, these files will always stay activated on your computer, as long they are not modified. You can save the created visualizations and load them again later with File -> Load Visualization, without having to activate them again. Saving makes it easier to re use your visualization later on, with the same or with new expression data. Thus it can save a lot of time: Calculating these small example files happens really fast, but for real complex hierarchies it can take several hours; even days. Reloading such a complex hierarchy as already saved visualization later takes only seconds.
Proceed the exact same way with the genome and the streamgraph examples, by choosing the respective menu items from Paver:
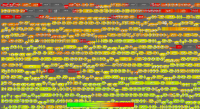
- for Genome View files, click on File -> New -> Genome View, and
- for Streamgraph files, click on File -> New -> Stream Graph -> etc..
Typically, Stream Graphs differ in one point from the other types of visualization: they can't be visualized without any data at all, and to create a stream of data, they need multiple data files. Therefore, instantly after having picked your Stream Graph file you are asked for the data files. Please select all data files you want to include into the graph directly in this step.
|
Please note: Our Examples can be activated for free on every computer as long as they are unmodified, when using the credentials of the Evaluation Account on our Consumable Server. For loading your own data, you will need to have your own Consumable account, which should have enough credits for activating your data. For details please refer to this page. |
Getting Started
The Getting Started Guide helps to get started to create visualisations with example data as quick as possible. Read it online, print it, or ask us for a copy - and enjoy working with Paver!
Each version of the Getting Started Guide is referring to a complete set of example data. Please find each data set below.
Paver Getting Started Guide
The Getting Started Guide is available in English.
Click on the symbol below to load the PDF file:
Example Data
Download the sample data described in the Getting Started Guide:

This archive includes hierarchies with 4 sublevels below root, containing 6 clusters on the first sublevel.
The quantitative data has been generated synthetically, showing some changes between the two data sets.
As for now, the hierarchies are included in 5 different types, partially with hints (readme.txt) and variants: Simple Format, Path Format, Newick, FunCat and KEGG

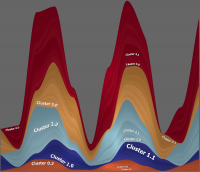
This archive includes basically the same hierarchy as before, but now as streamgraph and just containing the first 4 clusters on the first sublevel. This hierarchy is provided in two formats: the Simple Format and the Path Format.
Technically the hierarchy files are in the same format and structure, so that you can use the same files and formats as for the treemaps.
There are two sets of quantitative data contained, both generated synthetically as well. In the first set, clusters are positively correlated, in the second some clusters are correlated with the others with a certain time shift.


