Benefits
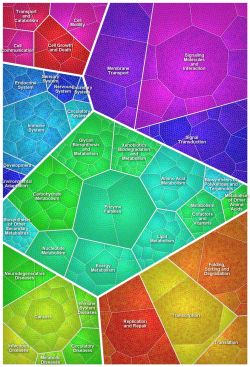
Space for visiualization is always limited. A very promising technology to show hierarchically organized data on a very compressed, while still intuitively understood way are Voronoi Tree Maps.
That's what we thought when starting a project to translate this technology into a product.
Find similarly behaving genes and proteins - clearly highlighted

Quantitative data may be grouped by function to make them available for further interpretation and analysis. This allows you to find interesting functional coherencies within biological systems and discover new patterns never seen before in your data.
Visualize quantitative data - hierarchically organized
Paver presents your expression data with hierarchically organized data from KEGG, Gene Onthology or others. This allows you to quickly identify the different classes and subclasses.
Additionally, classes and subclasses across all hierarchy levels are shown as convex objects making it easy to distinguish between classes of the same level easily.
Integrate your data with a maximum of knowledge already available
You won't have to re-invent the wheel. To allow for making use of knowledge already available, Paver supports:
- Gene Ontology,
- KEGG Brite,
- Riley scheme derivatives (e.g. TIGR classifications, Genolist classifications),
- Clusters of Orthologous Groups (COG),
- Open Biologicy Ontologies (OBO),
- gene regulatory data, and
- custom classification schemes.
Make use of every pixel: Aggregate expression data on a minimum of space
Your screen space is limited. Therefore, Paver allows for defining a certain size of the desired image. Your data is then mapped into this area making use of every single available pixel.
