Getting Started
The Getting Started Guide helps to get started to create visualisations with example data as quick as possible. Read it online, print it, or ask us for a copy - and enjoy working with Paver!
Each version of the Getting Started Guide is referring to a complete set of example data. Please find each data set below.
Paver Getting Started Guide
The Getting Started Guide is available in English.
Click on the symbol below to load the PDF file:
Example Data
Download the sample data described in the Getting Started Guide:

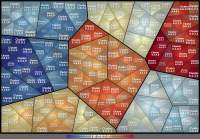
This archive includes hierarchies with 4 sublevels below root, containing 6 clusters on the first sublevel.
The quantitative data has been generated synthetically, showing some changes between the two data sets.
As for now, the hierarchies are included in 5 different types, partially with hints (readme.txt) and variants: Simple Format, Path Format, Newick, FunCat and KEGG

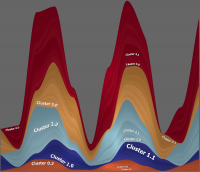
This archive includes basically the same hierarchy as before, but now as streamgraph and just containing the first 4 clusters on the first sublevel. This hierarchy is provided in two formats: the Simple Format and the Path Format.
Technically the hierarchy files are in the same format and structure, so that you can use the same files and formats as for the treemaps.
There are two sets of quantitative data contained, both generated synthetically as well. In the first set, clusters are positively correlated, in the second some clusters are correlated with the others with a certain time shift.


