Web Reports
Delta2D's interactive reports make it easy to present and summarize your experimental setup, relevant spots, and quantitative data. They are based on HTML so you can put them on the web easily. The reports are shown in your web browser so you can copy all or part of a report into your favorite word processor or presentation program. All reports are interactive. For example, clicking on a dual channel image in the project report will open the corresponding gel image pair in Delta2D. All reports can be accessed via the Reports menu.
Example reports can be viewed here.
Project Summary

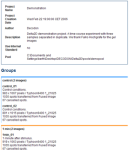
The project report shows a summary of your analysis project. It includes an overview of gel images and warpings as well as general data about the gel images, groups, spots, and samples. The dual channel images included in the report give a good indication of the quality of the direct warpings in the project. You can open a dual channel image in Delta2D by clicking on it. Just like all reports you can click the save button to save it in a form that is ready to be published on the web. Example
Spot Album

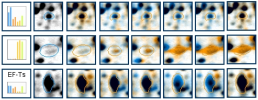
The spot album shows thumbnails of marked or selected spots and the region surrounding them. You can show spots in single or dual channel images. The album can easily be configured within the report: You can select an image and whether spots have to be marked or selected on this image to be included in the report, another image which should complete dualview thumbnails, and the width and scale of the gel section that should be displayed. Next to each spot row there is the expression profile as a chart. Clicking on the expression profile takes you to a detail page that shows additional quantitative data. Click on any thumbnail in the row to select and show it in Delta2D's dual view. Example
Labels

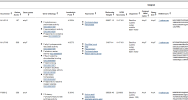
The label report lists the data which has been imported from web based ressources like UniProt or similar data bases. For known protein names you can employ DECODON Scouts to attach this additional data as label data to the respective spots and then show all labels in this report. Example
Spot Quantities

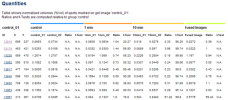
The spot quantities report shows expression profiles numerically, together with group-wise ratios and t-Test values. For including them in the report, mark or select spots of interest by marking or selcting them on a certain gel image. This report is well-suited for documenting a set of relevant spots, and for further statistical analysis. Example
Blotting Report

In our classic workflow you detect the consensus spot pattern on a fusion image and transfer it to all other images to get 100 % spot matching. However, to enable the determination of coverage values between Western Blots and Gel images, finally you have to narrow down the spot sets on the individual images by given constraints. To do so, Delta2D offers powerful filter tools in the spot tables as well as complex algorithms and tests in the analysis module. Once you have your individual spot sets per image, the new Blotting report will do the rest for you. Example
Saving, Modifying, and Printing Reports
All reports are produced in the form of HTML pages that are generated dynamically by Delta2D. This means you can easily integrate them into your current project documentation: just select a part of the page and copy it into a MS Word™ or MS PowerPoint™ document. You can save the whole report using the Save button in the top right of the report. The sub-pages (e.g. expression profile details from the spot album) will also be saved and linked properly. The result is a set of HTML files and images that can be put directly on the web. You can print the report directly from your web browser, or use a word processing program for more advanced printing needs (e.g. splitting wide pages).
